View all your analytics in real-time
Your allotment divided by your contracted CPM is a guaranteed number of views. This is where you watch us deliver it — views, CPM and performance in real time. We are a service, not software you have to run: the reporting is ours to produce, not yours to assemble.
- Vetted ambassadors
- 40,000+Vetted ambassadors
- Countries
- 60+Countries
- Videos per month
- 10–5,000+Videos per month

You see what we delivered, in real time.
This is not a tool we hand you. It is the window onto a program we run — views, guarantee balance and pipeline, updated as collection runs, with every series stating the date it is good through.
Brand home · Analytics
- Last 28 days
- All campaigns
- All platforms
Views today
341,500
+12% vs yesterday
Intraday, all platforms · data through 09:40 UTC
Guarantee balance
$72,400
spent of $100,000 funded
7,240,000 of 10,000,000 guaranteed views delivered · warm-up reach excluded
Next report
Mon 09:00
Weekly summary, written and sent by your program lead. It reads the same precomputed rows as this dashboard, so the two can't disagree.
Report period: 28 days · projection horizon capped at 90
- Analytics
- Attribution
- Insights
Views · daily
7,240,000
- Daily
- Total
Views data through 1 Sep · TikTok through 1 Sep · YouTube through 31 Aug
- Daily views
- Breakout day
- Gap — nobody collected that day. Never drawn as a zero.
5 Aug — 1 Sep
Likes
486,300
+14.2% · through 1 Sep
Engagement rate
7.1%
+0.4pp · through 1 Sep
Comments
38,900
Counts only · through 1 Sep
Shares & bookmarks
61,400
+9.8% · through 1 Sep
Top posts
By views · last 28 days
Roster pipeline
- Invited & accepted
- 142
- Trial videos in review
- 96
- In warm-up
- 34
- Active roster
- 61
+18 this week
Filmed before product access · never billed to you
412,000 warm-up views · not counted toward your guarantee
Top performers get more of your allotment, underperformers are rotated out — nothing you need to do.
Illustrative view, drawn on our published worked example — a $100,000 monthly allotment at a $10 contracted CPM, which is 10,000,000 guaranteed views. Your CPM is benchmarked to your program, not read off a rate card. You are not operating any of this: we run the program and the reporting, and the screen is where you watch the guarantee being met.
Brand home
One number carries the whole contract.
Your monthly allotment divided by your agreed CPM is a view target, and we carry the risk on it. The meter shows delivered against that target, every day, without you asking anyone.
It is a floor, not a target. Overdelivery costs you nothing. A shortfall does not evaporate at month end — allotments stack, so what we owe you carries into the next month until it is delivered.
Guarantee meter
$100,000 · $10 CPM
July · target 10,000,000
8,600,000 delivered
1,400,000 short. It does not expire — it is added to August.
August · target 11,400,000
11,900,000 delivered
10,000,000 plus July's 1,400,000, and 500,000 over the line. Overdelivery is free.
September · target 10,000,000
7,240,000 to date
In flight. Warm-up reach is excluded from this bar — we fund it, and it never carries your brand.
What the views cost, and what they were worth.
Views delivered times your contracted CPM. Then the same money divided two ways — by every signup we can attribute, and by the signups that would not have happened without us.
Illustrative arithmetic — our published worked example at a $10 contracted CPM, not a quote
Cost of views delivered
$72,400
7,240,000 views delivered × your $10.00 contracted CPM ÷ 1,000. Creators, production, usage rights and payouts are already inside it.
Cost per signup
$13.98
5,180 attributed signups in the 28-day report period, read from the analytics source you connected.
Cost per incremental signup
$21.17
3,420 signups above the modelled counterfactual. 95% band $18.42 – $24.88. This is the number that survives an argument.
The third figure only appears once there are 28 clean baseline days behind it, and it is only called full confidence at 56. Before that you see observed and attributed counts and nothing else — no counterfactual, no band, no cost-per-incremental line.
Reporting is part of the service, not homework.
There is no refresh button, because there is nothing for you to trigger — collection runs on a schedule we operate. Your program lead writes the weekly summary off the same rows this screen reads, so the two can't disagree.

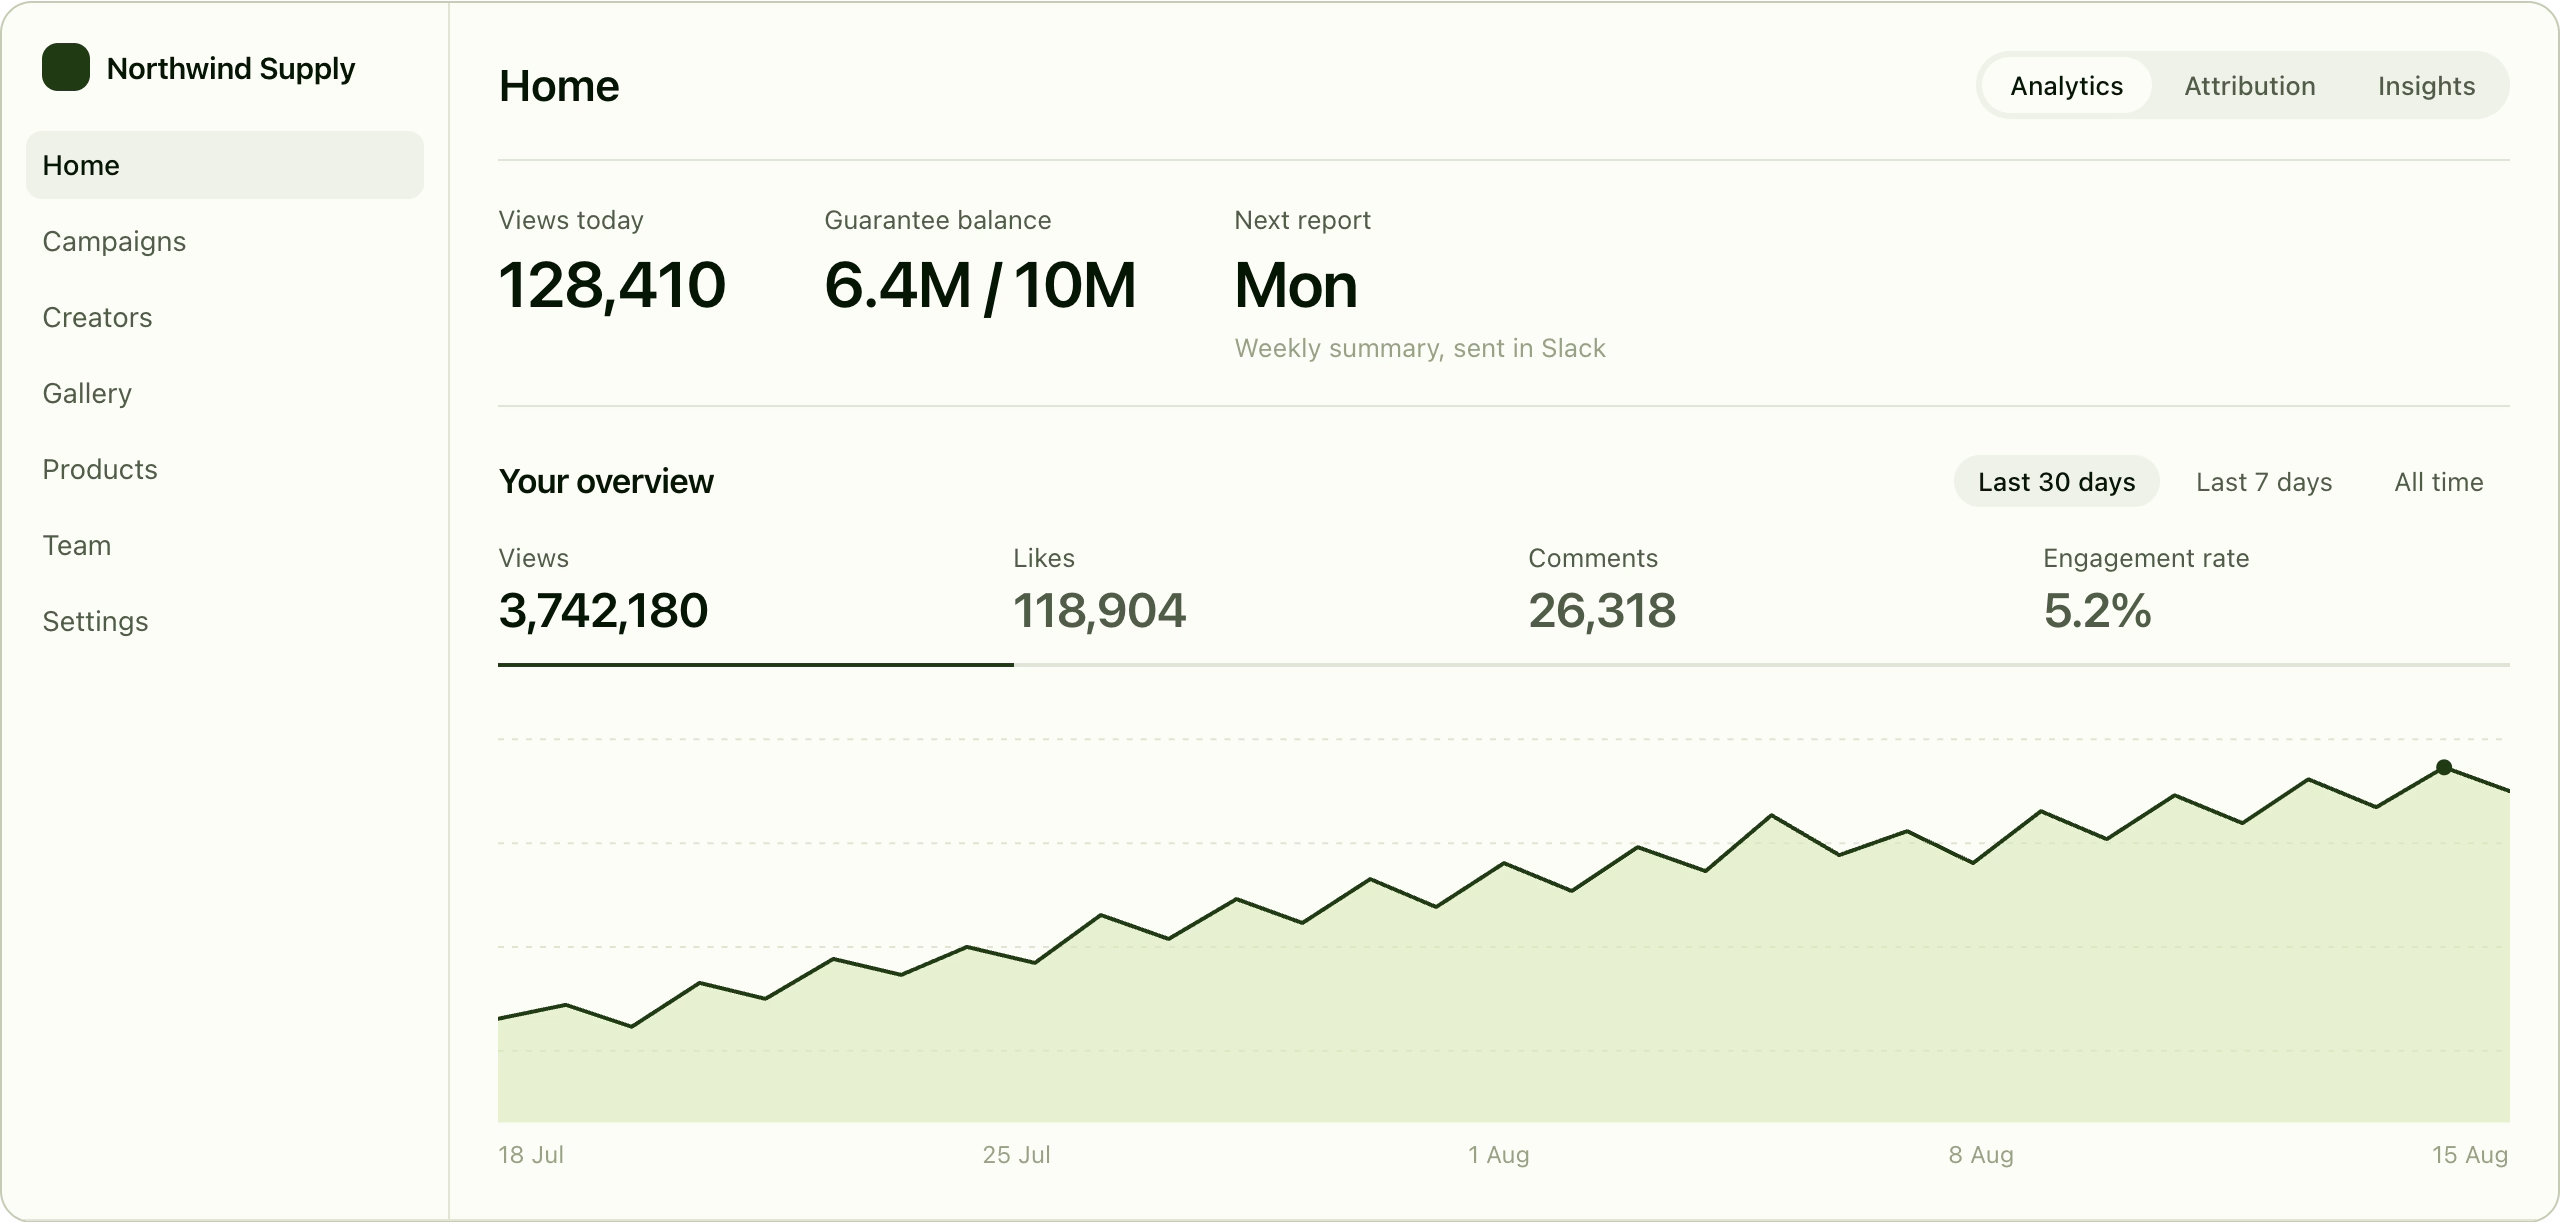
- Home
- Campaigns
- Creators
- Gallery
- Products
- Team
- Settings
Home
- Analytics
- Attribution
- Insights
- Views today
- 128,410
- Guarantee balance
- 6.4M / 10M
- Next report
- Mon
- Weekly summary, sent in Slack
Your overview
- Last 30 days
- Last 7 days
- All time
- Views
- 3,742,180
- Likes
- 118,904
- Comments
- 26,318
- Engagement rate
- 5.2%
Illustrative view of the brand home you are given — nothing to configure, nothing to refresh.
Brand home
The roster rotates on the numbers.
Top performers get more of your allotment, underperformers are rotated out — nothing you need to do. Per creator you see delivery and results; rates, payouts and rotation are ours to run against your contracted CPM.
Which ambassadors actually moved something.
Every creator carries their own tracking code, so performance is not a wall of impressions. Click-throughs, signups and installs land against the person who earned them — and we rotate the roster on it so you never have to.
| Creator | Tracking code | Platforms | Click-throughs | Signups | Installs | Breakouts |
|---|---|---|---|---|---|---|
| @ambassador handle | FL-0421 | TikTok, Instagram | 18,420 | 742 | 511 | 2 |
| @ambassador handle | FL-0387 | Instagram, Facebook | 12,905 | 508 | 340 | 1 |
| @ambassador handle | FL-0412 | YouTube | 9,140 | 331 | 208 | 0 |
| @ambassador handle | FL-0355 | TikTok, Facebook | 8,760 | 402 | 275 | 1 |
4 of 61 creators on your delivered roster. No CPM column, no payout column — the creator economics are ours to run.
Creators
A breakdown with an honest denominator.
Gender, country, age range and platform, weighted by views across the accounts on your roster. Every breakdown carries the count it was built from, so you always know how much of the roster it speaks for.
Filter by campaign or platform and the weighting is recomputed, not sliced off a cached total. The creators who have not filed analytics yet are missing from the denominator, and we say so rather than quietly assuming they look like everyone else.
Coverage
Based on 47 of 61 creators on your roster
Gender
- Female
- 62%
- Male
- 35%
- Other
- 3%
Age range
- 18–24
- 38%
- 25–34
- 41%
- 35–44
- 15%
- 45+
- 6%
Countries
- United States
- 41%
- United Kingdom
- 14%
- Germany
- 9%
- Brazil
- 7%
Platform
- TikTok
- 48%
- 27%
- YouTube
- 14%
- 11%
Real-time is easy. Defensible is the work.
A dashboard that flatters you is worthless in a budget meeting. These are the rules we hold ourselves to before a number reaches your screen.
Countries
Share of audience · based on 6 creator accounts
- United States
- 41%
- United Kingdom
- 19%
- Germany
- 12%
- Sweden
- 9%
Platform
Views by platform · last 30 days
- TikTok
- 1,945,900
- 1,160,076
- YouTube
- 636,204
Posting activity
Videos posted per day · last 14 days
Illustrative view. Every panel names its own basis and its own window, right on the panel.
Insights
- 01.
A gap is never a zero
A day nobody collected is drawn as absent and named as absent. A fabricated zero is indistinguishable from a real quiet day, and it drags your baseline down on evidence nobody collected.
- 02.
Your ad spend is a control
Your own paid spend enters the model as a control, so signups your money bought are never attributed to us. If the coefficient comes back negative we refuse it outright rather than banking the flattery.
- 03.
We won't mark our own homework
Social-organic traffic is not claimable lift — our ambassadors post on exactly those platforms. Branded search is corroboration, never a claim. Every lift figure ships with its 95% band, because a point with no range is a sales asset, not a measurement.
- 04.
No lift claim on a thin baseline
Twenty-eight clean days of history before we will quote a counterfactual, fifty-six before we call it full confidence. Below the floor you get observed and attributed counts, labelled as exactly that.
- 05.
Your survey beside our model
Your own “how did you hear about us” answers sanity-check the modelled delta — they never produce it. When the two disagree the report leads with the range, never with the more flattering of the two.
- 06.
Every series states its own freshness
No global “synced three hours ago” averaging a lie across four collection tiers. Each number carries the date it is good through, and immature days are named rather than quietly counted.
We stand up the connections, then backfill 180 days.
Views we collect ourselves. Signups live in your stack, so we connect to it — read-only, vaulted, revocable from your account in one click. It is a short curated set we set up with you on the onboarding call, not a catalogue for you to shop through.
The baseline needs history, so on connect we pull 180 days back. That is what lets us quote a counterfactual at 28 clean days instead of a quarter from now.
Product analytics · signup baseline & lift
- PostHog
- Amplitude
- Mixpanel
- GA4
- AppsFlyer
Search & web · corroboration only
- Google Search Console
Branded search moving with your views is evidence. It is never itself a billable claim.
Your ad accounts · paid deduction
- Meta Ads
- TikTok Ads
Spend only — we never read your creative, impressions or conversions. It exists so your own money is subtracted before we count anything as ours.
Questions we get on the reporting.
The ones brand teams ask on the first call.
How real-time is real-time?
Views move through the day and each series states the date it is good through. There is no refresh button, because there is nothing for you to trigger — collection runs on a schedule we operate.
When do I get an incrementality number?
After 28 clean baseline days, and we only call it full confidence at 56. Before that you get observed and attributed counts, plainly labelled as such.
Does warm-up reach count toward my guarantee?
No. Warm-up posts are funded by us, never carry your brand, and never move the allotment meter. Their reach appears in analytics totals and nowhere that touches your invoice.
What happens if a month comes up short?
The shortfall is added to the next month's target. Allotments stack, so nothing expires at month end — and if we go over the line, the overdelivery costs you nothing.
Can I see what each creator costs?
No, and deliberately so. Per creator you see delivery and results — views, click-throughs, signups, installs, breakouts. Rates, payouts and rotation are ours to run against your contracted CPM.
Do I have to assemble the reporting?
No. Your program lead writes and sends the weekly summary, off the same rows this screen reads. Reporting is part of the service, not homework we hand you.
Tell us the goal. Watch the meter fill.
Your job is one strategy call. Ours is everything after it — the creators, the posting, the quality bar, the payouts, and the number you take into your next budget meeting.