Everyone reports views. We report what would not have happened without us.
A view count is an activity log, not evidence. Fluencify fits a counterfactual on your own pre-treatment history — what your signups would have done had we never run — and bills the difference. Every figure ships with its interval.
- Days of clean history before we quote a lift figure
- 28Days of clean history before we quote a lift figure
- Days before we call it full confidence
- 56Days before we call it full confidence
- Interval carried by every figure we publish
- 95%Interval carried by every figure we publish

The guarantee is the promise. The measurement is how we prove we kept it.
The promise
You buy views, not videos. One fixed monthly allotment at a CPM benchmarked to your business converts into a guaranteed number of views. The guarantee is a floor, not a target — overdelivery is free, shortfalls roll forward.
The proof
Meeting a view floor is the easy half. The report then values those views: what they moved, what it cost, and cost per incremental signup measured against the same contracted CPM you signed.
The one number is incremental signups.
Modelled against your own baseline, controlled for your own ad spend, and quoted as a range. Never a point without a band.

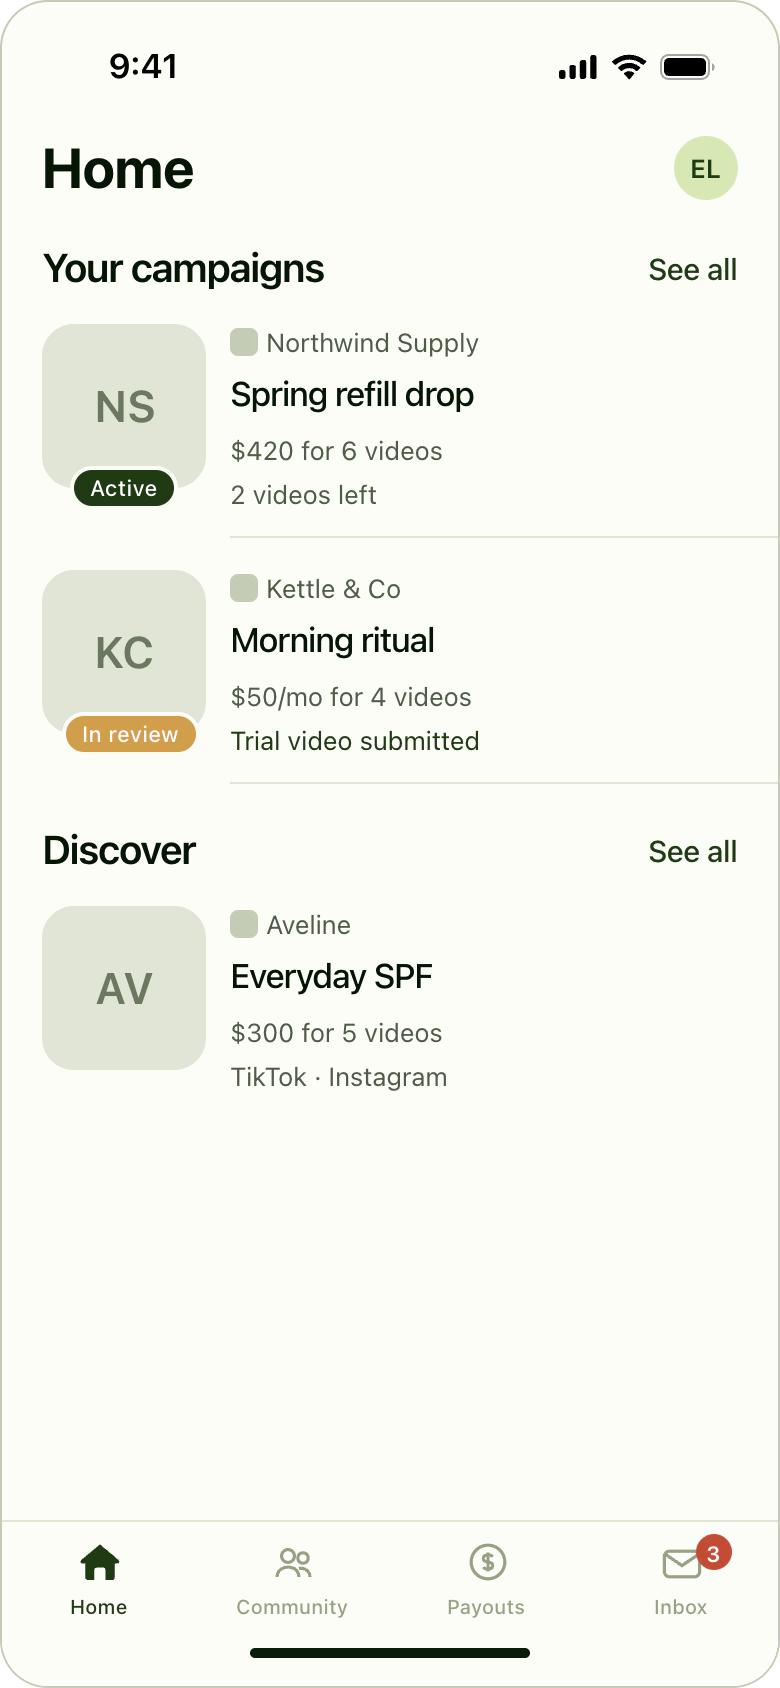
Measurement report
Northwind Supply · drawn at 15 Aug 2026
- Signups observed
- 14,206
- Attributed
- 3,918the client's own tools claim it
- Organic lift
- 2,604unattributed pool, inferred
- Corroboration
- Strongbranded search agrees
The header of the report itself. Attributed is only what your own tools claim; organic lift is an inferred share of the unattributed pool, and it is labelled that way on the page your analyst reads. Interface content is illustrative.
We fit what your business would have done without us
A baseline model is least-squares fitted on the log of your signups — trend plus a weekday factor — using only days an operator has confirmed as pre-treatment. It re-fits on a rolling window as your history grows.
Billable lift is the gap between what happened and that fitted line. Nothing else.
Lift report · 28-day period
Observed signups vs modelled counterfactual
- Observed signupsWhat your own analytics source recorded, day by day.
- Counterfactual · 95%The fitted baseline, drawn as a band. Never as a line alone.
- Program liveDays before this mark are the only ones the fit is allowed to see.
- What we bill
- The area above the band, summed across the period. Signups the baseline did not predict.
- What we do not bill
- Everything inside the band. That is your business running, and it was going to run anyway.
- What ships to you
- A range rather than a number, the caveats that apply to it, and the daily breakdown behind every line.
Wireframe of the report layout. Shapes are illustrative; the figures in your report come from your own connected sources.
Signups your money bought are not ours to claim
If your paid budget rose the same week our ambassadors went live, a naive lift figure quietly bills you for your own advertising. So your ad spend enters the model as a control. Whatever it explains, we hand back.
A negative coefficient is refused outright. A model claiming your advertising suppressed your signups is a broken model, not a finding — we stop rather than publish it.
What the model is allowed to read
- Your signup history, loggedTrend and a weekday factor, least squares.Fitted
- Your Meta Ads spendSpend only — no impressions, no clicks.Control
- Your TikTok Ads spendBuilt, not yet proven on a live advertiser.Control · unverified
- Your paid-social conversion rateSets the measurability floor. No default anchor.Your number
- Operator-confirmed pre-treatment daysThe only days the fit is allowed to see.Gate
- Sessions and pageviewsNothing in the model reads your site traffic.Not read
- Platform-reported conversionsWe take spend from ad accounts. Nothing else.Not read
When a guard fails
An ad whose spend fails a guard is excluded from the period until a human resolves it. Billed-with-a-flag does not exist here — the number waits rather than shipping wrong.
When there is no control
If no control could be established for a period, the report says so on its face, and no organic-lift figure in it may be claimed. Silence fails closed, not open.
There is no point without a band
A single number is a claim about certainty that nobody has. Every lift figure carries its 95% interval, and every statement line carries the daily breakdown behind it. A line carrying only a total is an assertion.
How the industry reports it
“The campaign drove N new signups.”
One figure, with no baseline named, no interval, no fit window, and no way for your analyst to check it. It is not wrong so much as uncheckable — and uncheckable is the same thing as unproven.
How we report it
A range, its fit window, and the days behind it.
If the interval is wide, you see that it is wide. We would rather hand you an honest range you can argue with than a confident number you cannot.
The things we refuse to claim
Anyone can produce a larger number by quietly relaxing a rule. We would rather publish the rules. Every exclusion below costs us money on the invoice, which is exactly why it is worth telling you about.
- 01.
Social-organic traffic as lift
Our own ambassadors post on exactly those platforms. Counting the traffic that arrives from them as proof of lift would be marking our own homework, so it never enters the billable number. Billable lift is unattributed signups only.
- 02.
Branded search as a claim
More people typing your brand name into a search box is a genuinely good sign, and it is corroboration that something moved. It is not a line on your invoice. Corroborating evidence sits beside the number, never inside it.
- 03.
Lift broken out per channel
The source-mix cut and the pooled cut are independent folds of the same period. A per-channel share cannot honestly be read off the pooled delta, so we do not publish one — however much everyone would like the slide.
- 04.
A daily view series inside the model
The measurement record has no day-by-day view series. That stage of the corroboration cascade is printed as missing rather than back-filled with a plausible-looking proxy. Delivery reporting and lift measurement are separate things and we keep them separate.
- 05.
Your site traffic
Nothing here reads your sessions or your pageviews. Where the report uses the word traffic it means signups that arrived carrying a referrer we can classify — and the report spells that out rather than letting you assume the bigger thing.
- 06.
A number we cannot stand behind yet
Under 28 days of clean pre-treatment history there is no lift figure to quote, and we say the baseline is short rather than quoting one anyway. The measurability floor is computed against your own paid-social conversion rate — your number, never ours, and it refuses to run without one.
A day we did not collect is a gap, not a zero
A fabricated zero is indistinguishable from a genuinely quiet day, and it drags your baseline down using evidence nobody ever collected. So a missing day stays missing, and the report says which days those were.
Collection ledger · one source · 28 days
- Collected
- Gap
- Immature
- CollectedCollectedCollectedGapCollectedCollectedCollectedCollectedCollectedCollectedGapGapCollectedCollected
- CollectedCollectedCollectedCollectedCollectedGapCollectedCollectedCollectedCollectedCollectedImmatureImmatureImmature
- Gap
- Nobody collected that day. It is excluded from the fit and listed on the report as a gapped period, not silently set to zero.
- Immature
- Too recent to be settled. Every source has its own reporting lag, so immature days are absent and named rather than counted early.
- Trailing outage
- A run of missing days at the end of a period is its own caveat on the report. A quiet tail and a broken pipe do not get to look the same.
Four stages of evidence. Only one of them is a claim.
The cascade cross-correlates weekday-adjusted residuals at zero to three day lags, looking for the shape you would expect if we were working. It reports evidence and it never gates the number.
Stage 01
Views
There is no day-by-day view series in the measurement record, so this stage prints as missing. We would rather show you a hole than a plausible invention.
MissingStage 02
Branded search
People looking your brand up by name, from Search Console. A rise here is a good sign that something moved, and it stays a sign.
CorroborationStage 03
Referred signups
Signups that arrived carrying a referrer we can classify. This is not your site traffic — no sessions and no pageviews are read anywhere.
CorroborationStage 04
Unattributed signups
People who simply turned up, above what the baseline predicted. This is the only stage that becomes a number on your invoice.
The claim
Signups vs baseline
Product analytics · confirmed CPM · last 30 days
- Lift above baseline
- +18.4%
- Breakout days
- 6
- Cost per incremental signup
- $2.14
- Attributed signups
- Modelled baseline
- Breakout day
The analytics view the report is drawn from: your own signup series against the modelled baseline, with the days that break out of it marked. Readings here are points; the report quotes the range. Interface content is illustrative.
Your survey, printed beside our model
The answers to your own “how did you hear about us” question sanity-check the modelled delta. They never produce it — a self-reported answer is a memory, not a measurement.
When the two disagree, the report leads with the range they span, never with the more flattering of the two.
The numbers that decide when we are allowed to speak
These are not soft targets we negotiate down at the end of a quarter. They are the gates the measurement runs behind, and a report period is 28 days long whether or not the answer is a good one.
- 28
Days · baseline floor
The least clean pre-treatment history we will quote any lift figure on. Below it, the report says the baseline is short and stops there.
- 56
Days · full confidence
Between 28 and 56 you still get a figure, and it arrives carrying a short-baseline caveat that we do not bury in a footnote.
- 90
Days · rolling window
The window the baseline re-fits on as your history grows, and the furthest ahead any projection is allowed to reach.
- 180
Days · backfill
Pulled from every source the moment it is connected, so history you already had becomes the baseline instead of waiting six months to build one.
We measure against your numbers, not ours
Nothing in the report is a number we made up on our own side. Each source below is a read-only connection your team approves once. We do the connecting, and 180 days of your history arrives with it.
PostHog
Product analytics. Daily signup counts as your own product already defines them.
Amplitude
The same series read from your Amplitude project, on its own reporting lag.
Mixpanel
Signup events straight from your Mixpanel workspace, no re-definition on our side.
Google Analytics 4
Conversion events from your GA4 property. We read the events you nominate, not your session data.
AppsFlyer
For mobile products, installs and in-app signups as your own attribution stack already records them.
Google Search Console
Branded search demand. It feeds the corroboration cascade and never the billable line.
Also connected, for the control
Your Meta Ads and TikTok Ads accounts, for spend only. Several connector contracts are still marked unverified in our own code, TikTok Ads among them, and we would rather tell you that than let a clean-looking logo imply a battle-tested pipe. Exchange rates are recorded by an operator, never fetched mid-report.
Cost per incremental signup, not just cost per thousand views.
You buy views at a CPM benchmarked to your business, and the guarantee is a floor rather than a target — overdelivery is free and shortfalls roll forward. That settles what you paid. The report settles what it was worth.
The worked example we publish is $100,000 a month at a $10 contracted CPM, and that is the whole invoice — creators, production, usage rights and payouts included. Incrementality is how you find out whether that invoice bought you anything you would not have had anyway.

How each line on a 28-day period is derived
- Views delivered
- Counted against the guaranteed floor for the period.
- Your contracted CPM
- Benchmarked to your business at signing. Not a rate card.
- Cost of the period
- Views delivered × your contracted CPM.
- Signups in the period
- Read from your own connected source, with its gaps named.
- Cost per signup
- Cost of the period ÷ every signup in it. The flattering one.
- Incremental signups
- The modelled delta, quoted as a 95% range.
- Cost per incremental signup
- Cost of the period ÷ that range. Because the denominator is a range, the answer is one too — and we print the whole of it.
A cost per signup that quietly includes the people who were coming anyway is not a cheaper number. It is a rounder one.
Every report carries the reasons it might be wrong
Caveats are not a legal appendix at the back. They sit on the face of the report, attached to the lines they affect, so your analyst can see the weakness before they see the number.
Short baseline
Fewer than 56 confirmed days behind the fit. You still get a figure, and you are told it is standing on less than we would like.
Thin fit window
Enough days to fit on, but not many. The interval widens on its own to reflect that, and the caveat explains why it widened.
Gapped period
Days inside the reporting period that nobody collected, listed by date rather than smoothed away into the average.
Trailing outage
Collection stopped before the period ended. A broken pipe at the end of a month looks exactly like a quiet week, so we label it.
Flat-mean fallback
The trend could not be fitted, so the baseline fell back to a flat average. That is a weaker claim and the report calls it one.
Control not applied
No usable ad-spend control for the period. The report says so on its face, and no organic-lift figure inside it may be claimed by anyone.
The questions your analyst will ask
These are the ones that come up on the second call, once someone technical has been added to the thread. We would rather answer them here.
Do we have to run any of this ourselves?
No. Fluencify is a service, not something your team logs into and operates. We make the connections, confirm which days count as pre-treatment, fit the baseline, write the report and then sit through the meeting where you take it apart. Your job is one strategy call. Ours is everything after it.
How much history do you need before you will quote a number?
After 28 clean baseline days, and we only call it full confidence at 56. Before that you get observed and attributed counts, plainly labelled as such.
Ask us what we would refuse to claim
One strategy call, and everything after it is ours. We connect your sources, build the baseline on history you already have, and the first report tells you what moved and how sure anyone is allowed to be about it.