Every number we publish is the client's own
We do not have a wall of case studies, and we are not going to build one out of numbers we made up. When Fluencify quotes a result it comes out of the client's own analytics, measured against a fitted baseline of what would have happened without us, with its confidence interval attached.
- 28 days
- Of clean baseline before we quote a lift figure at all
- 56 days
- Before we call that figure full confidence
- 95% CI
- Printed beside every figure we report

Latest case study
The two figures below are delivery numbers — views and the contracted CPM, the values the guarantee is written in.

Knownotes
knownotes.ai- 300M+
- Views delivered
- $0.07
- Contracted CPM
How we measure a result
Fluencify is a service: the guarantee is a contracted CPM and a monthly view floor. Views are what we guarantee, outcomes are what we measure — we model what would have happened without us and claim only the difference. Until there are published cases to show you, the method is the case study.
- 01.
The numbers are your analytics, not ours
We connect to the source you already trust — PostHog, Amplitude, Mixpanel, GA4, AppsFlyer or Search Console — and backfill 180 days at connect time, so the baseline is history you recorded before you met us.
- 02.
We fit a counterfactual on your own history
A baseline of what your signups would have done without us: an exponential trend with a weekday factor, fitted by least squares on log, using only operator-confirmed pre-treatment days and re-fitted on a rolling 90-day window.
- 03.
Your own ad spend goes in as a control
Signups your own money bought are not handed to us. Meta Ads and TikTok Ads spend enters the model as a control term, and a negative coefficient is refused outright rather than smoothed into a better-looking result.
- 04.
We wait for the baseline to mature
28 days of clean history before we will quote a lift figure. 56 before we call it full confidence. A day nobody collected is recorded as a gap, never as a zero — a fabricated zero is indistinguishable from a real quiet day and drags your baseline down with evidence nobody collected.
- 05.
One canonical number, with its interval
A single lift figure, reported over a 28-day period, always with a 95% confidence band. Projections are capped at a 90-day horizon. Every statement line carries its daily breakdown, because a line carrying only a total is an assertion.
- 06.
Corroboration, never a substitute
Branded search, traffic and unattributed signups are cross-correlated on weekday-adjusted residuals at zero to three day lags. That cascade reports evidence around the number. It is never allowed to produce the number.
- 07.
Your survey sits next to our model
Your own “how did you hear about us” answers are used to sanity-check the modelled delta, never to produce it. When the two disagree the report leads with the range, and never with the more flattering of the two.
What you can see while the baseline matures
Delivery is legible from the first week — where the ambassadors posting for you are, which platforms they posted on, and how the posting was spread. None of this is a lift figure. The lift figure waits for the baseline.
Countries
- United States41%
- United Kingdom19%
- Germany12%
- Sweden9%
Platform
- TikTok1,945,900
- Instagram1,160,076
- YouTube636,204
Posting activity
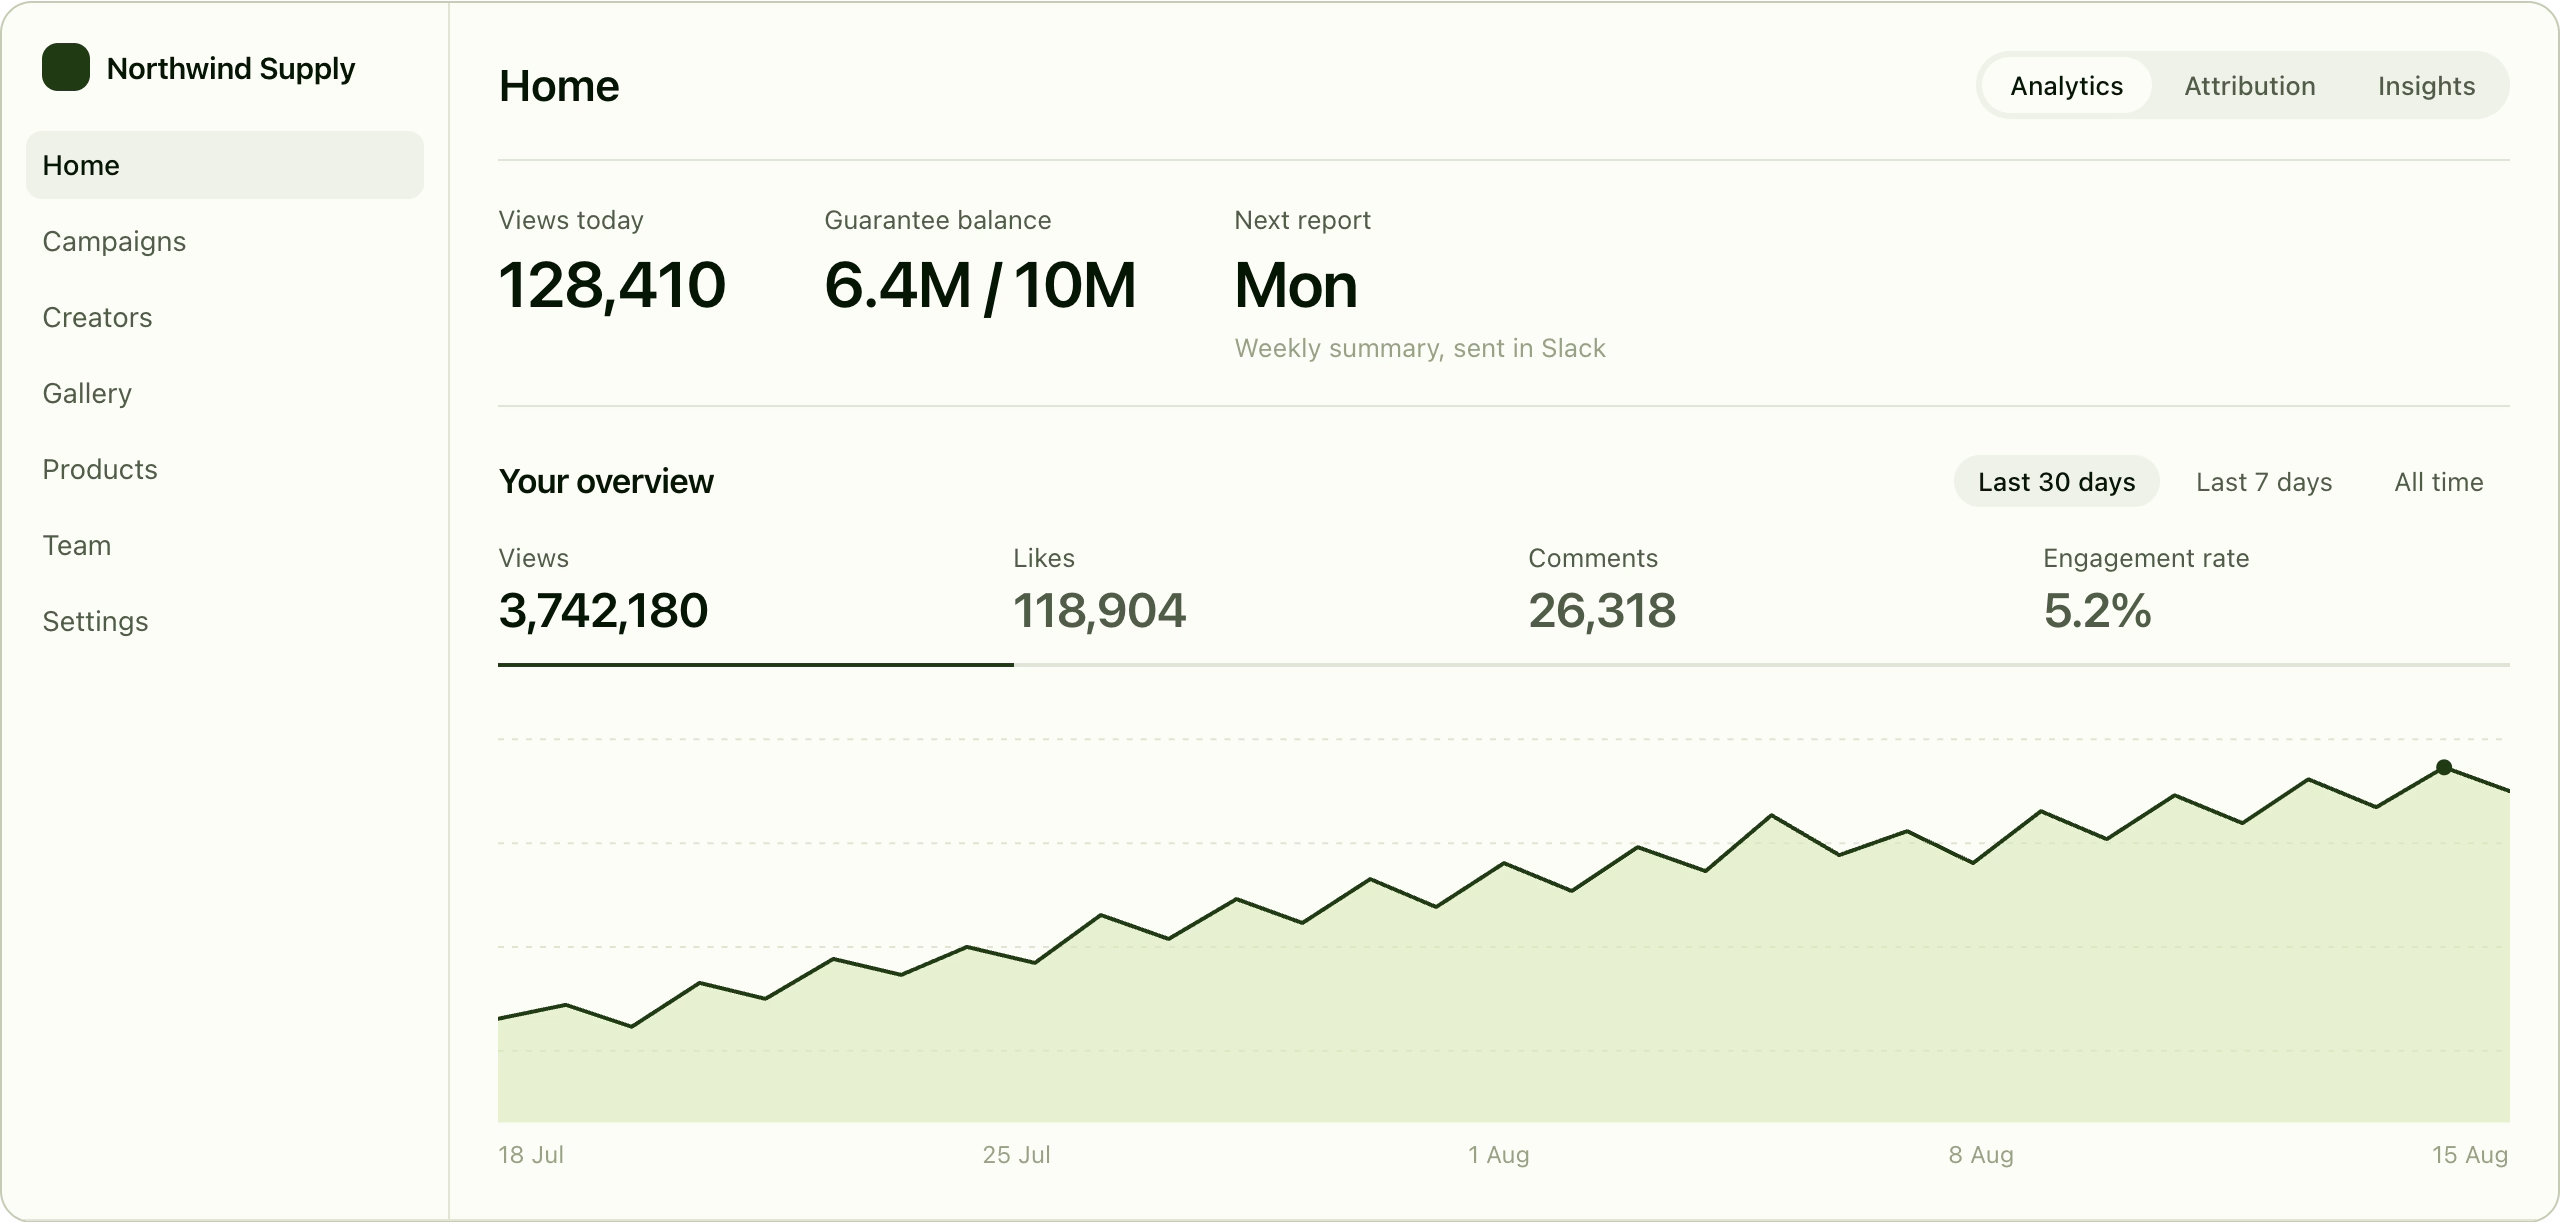
Sample data, not a client result
The dashboard above is shown with placeholder values so you can read the instrument itself. No figure on this page belongs to a client, and none has been cleared for publication.
What we will not claim, even when it would flatter us
A case study is only worth reading if you know what its author refused to count. Here is our list, and the model enforces it rather than good intentions.
Social-organic traffic
Our ambassadors post on exactly those platforms. Counting that traffic as our lift would be marking our own homework, so billable lift is unattributed signups only.
Branded search
Good corroboration that something moved in the market. It appears in the report as evidence and never as a claim or a billable line.
Lift split by channel
The source-mix cut and the pool cut are independent folds. A per-channel share cannot honestly be read off the pool's delta, so we do not quote one.
A day nobody collected
Recorded as a gap, never as a zero. Days that have not matured yet are named and left out rather than counted, and each source has its own lag.
A result with no control
If no control was established, the report says so and no organic-lift figure inside it may be claimed. Silence fails closed, in your favour.
A stage we can't fill
Where a piece of the corroboration cascade is missing, the report marks it missing. We do not substitute a proxy and present it as the real series.
Who we work with, and who we can name
The categories the service is built for
Consumer apps, AI tools, fintech, ed-tech, DTC and ecommerce, dating, health and wellness. Products where a signup or an install is the outcome, and where a micro-creator can plausibly be the customer rather than a spokesperson for one.
No logo wall, here or anywhere
A logo strip proves that a contract existed, not that the work moved a number — and a strip is the easiest thing on a website to pad. A published result carries the name of the client whose analytics produced it, in the shape set out below.
What a Fluencify case study will contain
This is the form every published case takes, and it is fixed before the measurement starts rather than chosen once the result is known. Publishing the standard before there is a case to put in it is the point — you can hold the first one to it.
- The client's own metric
- Named up front: signups, installs, trials or paid conversions. Whatever they already count in their own analytics, never a metric invented for the write-up.
- Metric name
- The baseline period
- The exact pre-treatment window the counterfactual was fitted on, how many clean days it held, and whether it cleared 28 days or the full 56.
- Dates, clean days
- Delivery against the guarantee
- The contracted CPM, the monthly allotment, the view floor we owed and the views actually delivered. Overdelivery shown, not quietly absorbed.
- Views vs floor
- The delta, with its interval
- Incremental signups over the modelled counterfactual, with the 95% band printed beside the figure. A point without its band does not go out.
- Lift ± 95% CI
- Cost per incremental signup
- Views delivered at the contracted CPM, divided by the incremental signups the model supports. The number a finance team can actually use, not cost per thousand views.
- Cost per signup
- The caveats that applied
- Short baseline, thin fit window, gapped period, trailing outage, control not applied. Whichever of them were true is printed in the case, not left out of it.
- Named in full
One case published, slots still empty
Knownotes is the first name on this page, and what it publishes is delivery — views and the contracted CPM. The value slots above stay empty until a client clears a full measured write-up in this form: views are guaranteed, lift is measured.
Questions about this page
Including the one you are already thinking.
Why is there only one case study on this page?
Because a case appears here only when the client behind it is named, and one is: Knownotes, with its delivery figures. We could fill the rest of the page with plausible percentages in an afternoon — most of the sites you are comparing us against already have. Every further case goes here in the form set out above, under the name of the client whose analytics produced it.
Do you use one client's numbers to sell to another?
There is no anonymised composite on this page and there never will be — “a leading fintech saw” is an invented case study with the name filed off. A result belongs to the client whose analytics produced it, and it stays theirs unless it is published under their name.
How long until I can see my own numbers?
Delivery and measurement run on different clocks. Your first videos can be ready in as little as 24 hours, and views show in your dashboard as they land. The lift figure waits for 28 days of clean baseline, and 56 before we call it full confidence.
So what is actually guaranteed?
Views. One fixed monthly allotment at a contracted CPM converts into a guaranteed number of views, and the CPM is benchmarked against real creator accounts in your niche rather than read off a rate card. It is a floor, not a target: overdelivery is free and shortfalls roll forward.
Who makes the videos?
Ambassadors — 40,000+ vetted micro-creators across 60+ countries who match the real-life profile of your ideal customer. Not influencers. No talent managers, no agency retainers. Every video is scored against your brand guidelines before it reaches you.
What do I get to see before signing?
The instrument rather than a highlight reel. What the report will contain is set out on this page: the sources it reads, the baseline it needs, the figure it produces and the caveats it names. None of it is decided after the result is in.
The next case study on this page could be yours.
One strategy call, then we run the program. You get a contracted CPM with a guaranteed view floor, and a measurement report built to the standard on this page.